Adelaide Oval, Adelaide, Australia Pitch Report, History, Stats & Records, boundary Dimensions
Adelaide Oval Pitch Report
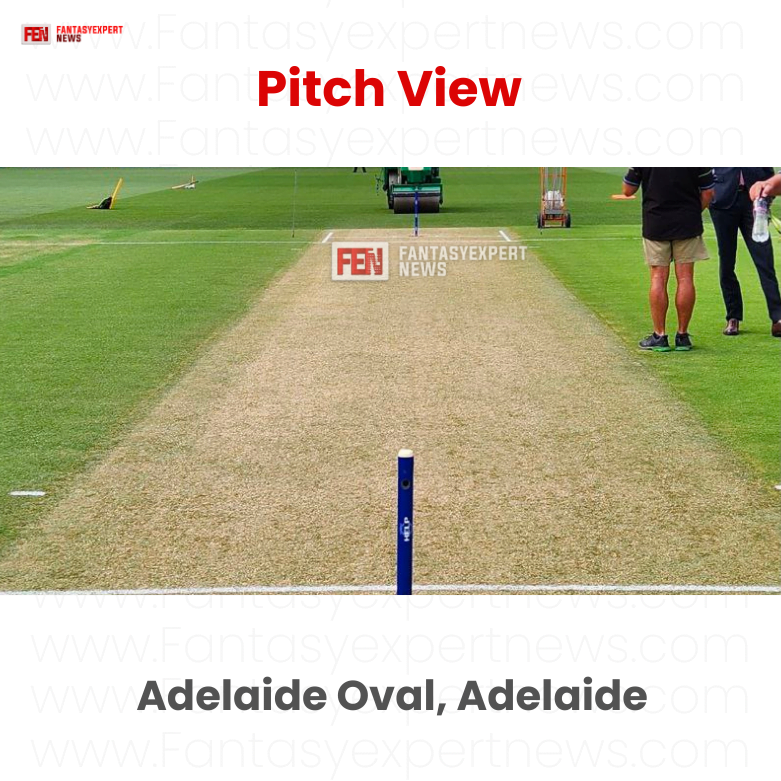
Adelaide Oval pitch is good for both batting and bowling, but fast bowlers might have a bit more advantage in the beginning. It’s better to bowl first and then chase the target. If a team bats first and scores more than 165 runs, it can be a good score to defend. So, teams need to plan smartly to make the most out of the pitch.
Adelaide Oval Pitch Report In Hindi
Adelaide Oval ka pitch batting aur bowling dono ke liye achha hai, lekin shuruaat mein fast bowlers ko thoda sa fayda ho sakta hai. Behtar hoga pehle bowling karein aur phir target ke peeche bhagein. Agar koi team pehle batting karti hai aur 165 run se zyada score karti hai, toh yeh ek achha score ho sakta hai bachane ke liye. Isliye, teams ko pitch ka sahi istemal karne ke liye chaturai se planning karni hogi.
Adelaide Oval Pitch View
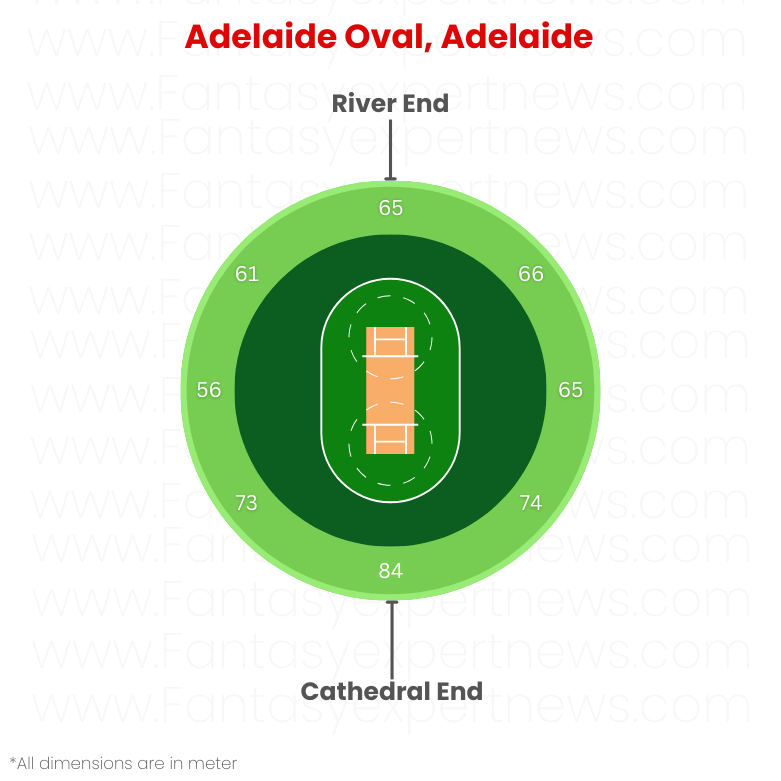
Adelaide Oval Boundary Dimensions
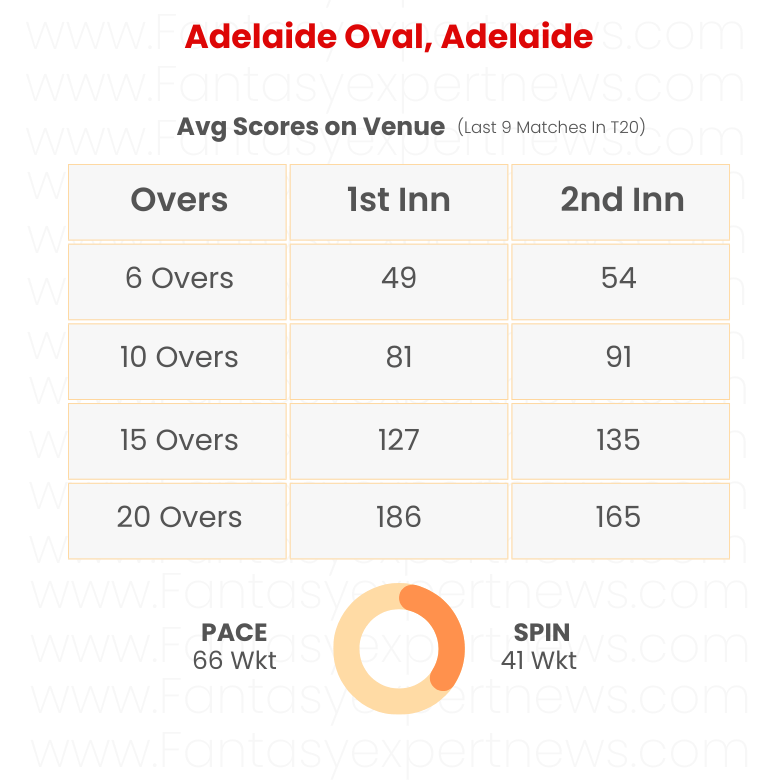
The average score at Adelaide Oval for both innings in T20 matches is:
Adelaide Oval Stadium Overview
Stadium Overview
- Established – 1873
- Capacity – 50,000
- Playing area – 190.2 m long, 126.2 m wide
- End Names – City End, Cathedral End
- Flood Lights – Yes
- Home Teams – South Australia
- Other Sports – Australian Rules Football (since 1877), Rugby League (1997-1998) as well as archery, athletics, baseball, cycling, american football, highland games, hockey, lacrosse, lawn tennis, rugby union, quoits and soccer
- Pitch – Grass
- Curator – Les Burdett
- Current Local Time – 19:38, Mon Feb 12, 2024
Nestled amid lush gardens and embraced by the graceful spire of St Peter’s Cathedral, the Adelaide Oval stands as a testament to cricket’s enduring charm.
If you want to stay updated with match predictions and Dream11 insights for Adelaide Oval matches, join our Telegram channel or visit our website. Stay ahead with expert analysis and predictions!
International Matches information
- First ODI match: West Indies vs Australia – December 20, 1975
- First Test match: Australia vs England – December 12 – 16, 1884
- First T20I match: Australia vs England – January 12, 2011
- First WODI match: Australia(W) vs NZ (W) – February 03, 1996
- First Women’s T20I match: Australia(W) vs England (W) – January 12, 2011
Adelaide Oval Stadium Stats & Record
Test Stats
Total Matches – 84
Matches won batting first – 41
Matches won bowling first – 24
Average 1st innings Score – 380
Average 2nd innings Score – 346
Average 3rd innings Score – 271
Average 4th innings Score – 208
Highest total recorded – 674/10 (151.3 Ovs) By AUS vs IND
Lowest total recorded – 77/10 (40.5 Ovs) By WI vs AUS
Highest score chased – 315/6 (134 Ovs) By AUS vs ENG
Lowest score defended – 184/10 (79 Ovs) By AUS vs WI
ODI Stats
Total Match Played: 85
Batting First Won: 46
Batting Second Won: 38
Tie: 1
Avg. Score in 1st bat: 233
Highest Score: Australia 369/7
Lowest Score: Australia 70/10
Scoring Pattern
Below Score 200: 21
Score between 200 and 249: 32
Score between 250 and 299: 25
Above Score 300: 7
T20I Stats
Total Match Played: 12
Batting First Won: 7
Batting Second Won: 5
Tie: 0
Avg. Score in 1st bat: 173
Highest Score: Australia 241/4
Lowest Score: Zimbabwe 117/10
Scoring Pattern
Below Score 150: 3
Score between 150 and 169: 4
Score between 170 and 189: 3
Above Score 190: 2
Also Read: Narendra Modi Stadium, Ahmedabad: ODI Stats, Records & Pitch Report
Recent Matches of T20 In Adelaide Oval
Recent Matches at Adelaide Oval
HH vs AS, 09 JAN 2024
HH: 165/7 (20 Overs)
AS: 168/5 (19.2 Overs)
Strikers won by 5 wickets
Fast Bowlers (1st Inn): 4 Spinners (1st Inn): 3
Fast Bowlers (2nd Inn): 4 Spinners (2nd Inn): 1
Powerplay (4 Overs)
1st Inn: 3
2nd Inn: 1
PS vs AS, 05 JAN 2024
PS: 153/7 (20 Overs)
AS: 154/1 (16.1 Overs)
Strikers won by 9 wickets
Fast Bowlers (1st Inn): 3 Spinners (1st Inn): 4
Fast Bowlers (2nd Inn): 1 Spinners (2nd Inn): 0
Powerplay (4 Overs)
1st Inn: 2
2nd Inn: 0
AS vs MS, 31 DEC 2023
AS: 205/4 (20 Overs)
MS: 211/3 (19.4 Overs)
Stars won by 7 Wickets
Fast Bowlers (1st Inn): 1 Spinners (1st Inn): 3
Fast Bowlers (2nd Inn): 1 Spinners (2nd Inn): 1
Powerplay (4 Overs)
1st Inn: 0
2nd Inn: 1
ST vs AS, 19 DEC 2023
ST: 200/7 (20 Overs)
AS: 205/4 (19.4 Overs)
Strikers Won by 6 Wickets
Fast Bowlers (1st Inn): 5 Spinners (1st Inn): 2
Fast Bowlers (2nd Inn): 2 Spinners (2nd Inn): 1
Powerplay (4 Overs)
1st Inn: 2
2nd Inn: 0
AS-W vs BH-W, 2 DEC 2023
AS-W: 125/5 (20 Overs)
BH-W: 122/8 (20 Overs)
Strikers Won by 3 Runs
Fast Bowlers (1st Inn): 3 Spinners (1st Inn): 2
Fast Bowlers (2nd Inn): 4 Spinners (2nd Inn): 4
Powerplay (4 Overs)
1st Inn: 1
2nd Inn: 0
PS-W vs AS-W, 24 NOV 2023
PS-W: 104/10 (19.4 Overs)
AS-W: 106/5 (14.5 Overs)
Strikers won by 5 wickets
Fast Bowlers (1st Inn): 7 Spinners (1st Inn): 2
Fast Bowlers (2nd Inn): 4 Spinners (2nd Inn): 1
Powerplay (4 Overs)
1st Inn: 2
2nd Inn: 1
BH-W vs ST-W, 24 NOV 2023
BH-W: 160/8 (20 Overs)
ST-W: 138/9 (20 Overs)
Heat won by 22 runs
Fast Bowlers (1st Inn): 5 Spinners (1st Inn): 3
Fast Bowlers (2nd Inn): 3 Spinners (2nd Inn): 4
Powerplay (4 Overs)
1st Inn: 0
2nd Inn: 1
AS vs PS, 20 JAN 2023
AS: 92/10 (17 Overs)
PS: 94/3 (11.1 Overs)
Scorchers won by 7 wickets
Fast Bowlers (1st Inn): 7 Spinners (1st Inn): 3
Fast Bowlers (2nd Inn): 0 Spinners (2nd Inn): 2
Powerplay (4 Overs)
1st Inn: 3
2nd Inn: 1
BH vs AS, 14 JAN 2023
BH: 154/10 (19.3 Overs)
AS: 137/9 (20 Overs)
Heat won by 17 runs
Fast Bowlers (1st Inn): 7 Spinners (1st Inn): 2
Fast Bowlers (2nd Inn): 5 Spinners (2nd Inn): 3
Powerplay (4 Overs)
1st Inn: 1
2nd Inn: 1
In the last 9 matches at Adelaide Oval:
Fast Bowlers (1st Inn): 42 Spinners (1st Inn): 24
Fast Bowlers (2nd Inn): 24 Spinners (2nd Inn): 17
Matches won by Batting 1st: 3
Matches won by Batting 2nd: 6
All Teams Record at Adelaide Oval, Adelaide, Australia
In Test Matches
| Team | Mat | Won | Lost | Draw | Tied | NR |
|---|---|---|---|---|---|---|
| Australia | 82 | 45 | 18 | 19 | 0 | 0 |
| England | 33 | 9 | 19 | 5 | 0 | 0 |
| India | 13 | 2 | 8 | 3 | 0 | 0 |
| New Zealand | 5 | 0 | 4 | 1 | 0 | 0 |
| Pakistan | 5 | 0 | 2 | 3 | 0 | 0 |
| South Africa | 9 | 2 | 4 | 3 | 0 | 0 |
| Sri Lanka | 1 | 0 | 1 | 0 | 0 | 0 |
| West Indies | 16 | 5 | 7 | 4 | 0 | 0 |
In ODI Matches
| Team | Mat | Won | Lost | Draw | Tied | NR |
|---|---|---|---|---|---|---|
| Australia | 53 | 37 | 16 | 0 | 0 | 0 |
| Bangladesh | 1 | 1 | 0 | 0 | 0 | 0 |
| England | 18 | 4 | 13 | 0 | 0 | 1 |
| India | 15 | 9 | 5 | 0 | 1 | 0 |
| Ireland | 1 | 0 | 1 | 0 | 0 | 0 |
| New Zealand | 17 | 9 | 8 | 0 | 0 | 0 |
| Pakistan | 19 | 4 | 14 | 0 | 0 | 1 |
| South Africa | 6 | 4 | 2 | 0 | 0 | 0 |
| Sri Lanka | 19 | 5 | 13 | 0 | 1 | 0 |
| West Indies | 20 | 11 | 9 | 0 | 0 | 0 |
| Zimbabwe | 3 | 0 | 3 | 0 | 0 | 0 |
In T20I Matches
| Team | Mat | Won | Lost | Draw | Tied | NR |
|---|---|---|---|---|---|---|
| Afghanistan | 1 | 0 | 1 | 0 | 0 | 0 |
| Australia | 7 | 4 | 3 | 0 | 0 | 0 |
| Bangladesh | 2 | 0 | 2 | 0 | 0 | 0 |
| England | 2 | 2 | 0 | 0 | 0 | 0 |
| India | 3 | 2 | 1 | 0 | 0 | 0 |
| Ireland | 1 | 0 | 1 | 0 | 0 | 0 |
| Netherlands | 2 | 2 | 0 | 0 | 0 | 0 |
| New Zealand | 1 | 1 | 0 | 0 | 0 | 0 |
| Pakistan | 1 | 1 | 0 | 0 | 0 | 0 |
| South Africa | 2 | 1 | 1 | 0 | 0 | 0 |
| Sri Lanka | 2 | 0 | 2 | 0 | 0 | 0 |
| West Indies | 1 | 0 | 1 | 0 | 0 | 0 |
| Zimbabwe | 1 | 0 | 1 | 0 | 0 | 0 |